FUD is good

Cryptic ball: fear, uncertainty, and doubt.
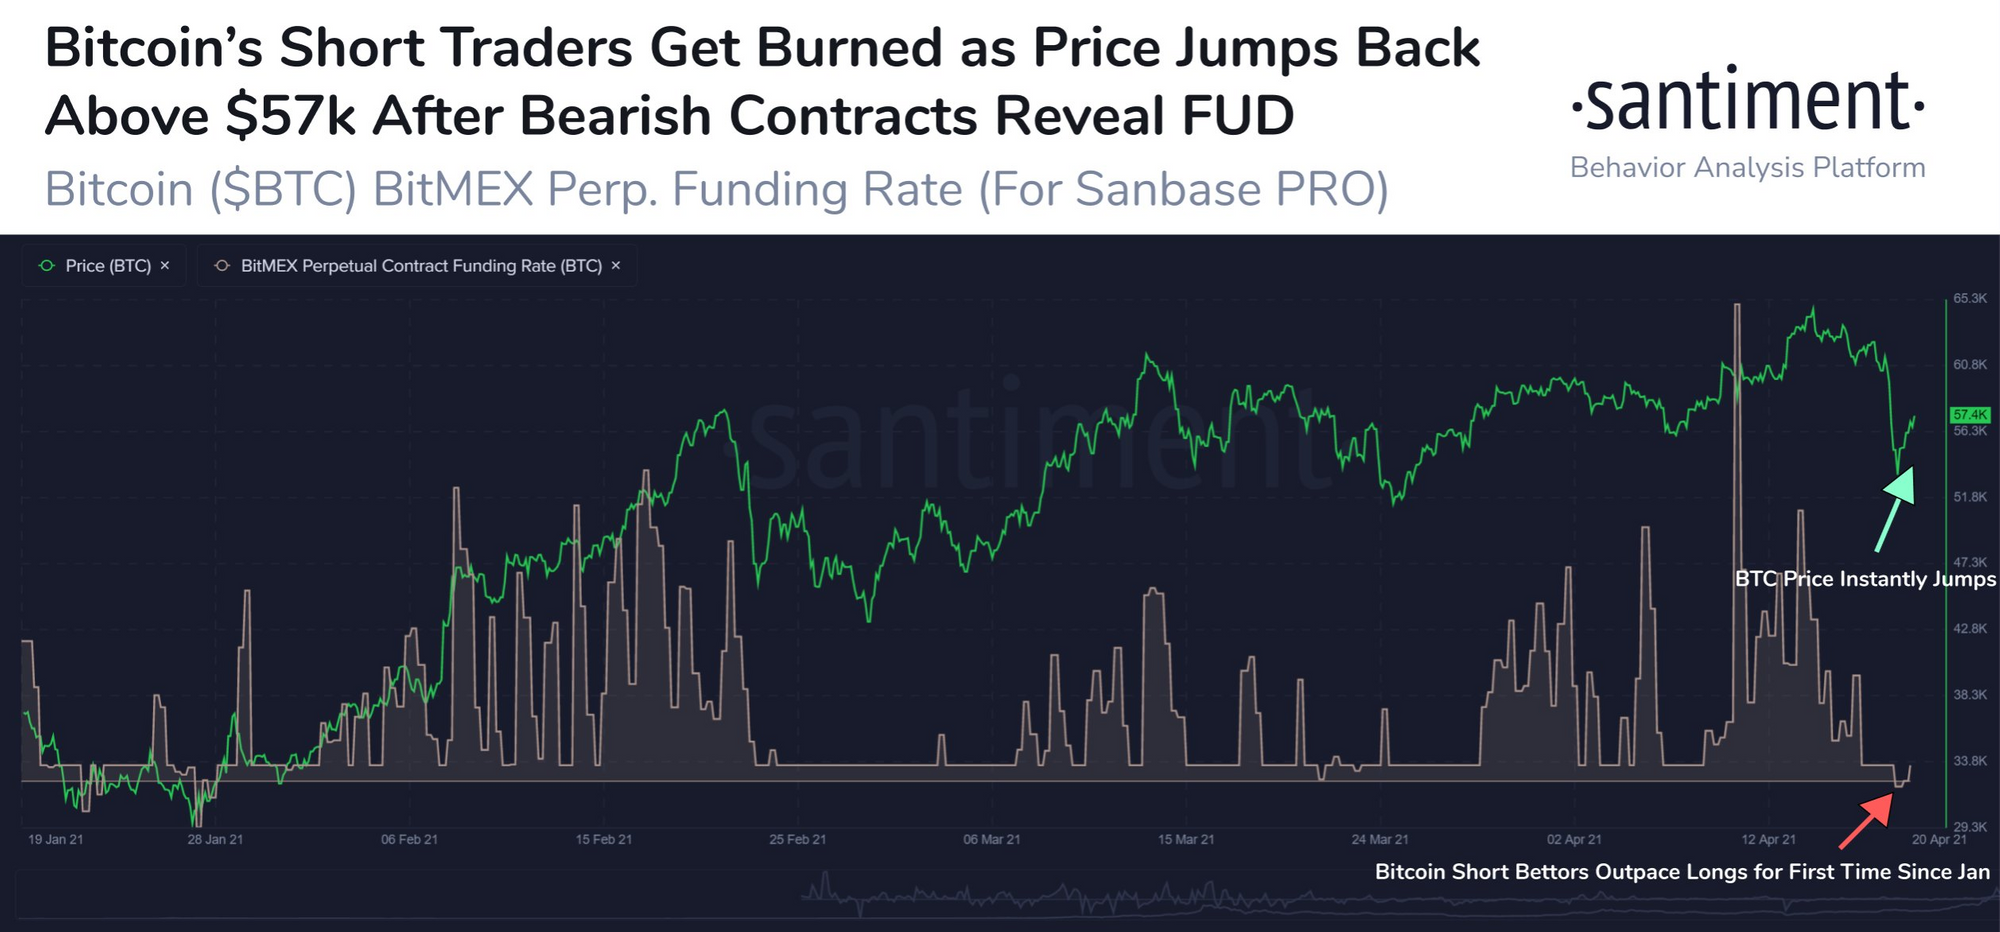
What have we told you Friday? Check if bitcoin finds support at $57k, otherwise a test of $50k is guaranteed. And that funding rates, i.e. the fee leveraged traders must pay to hold positions larger than the capital they are trading with, are key pieces for understanding local tops and bottoms. What happened over the weekend? Bitcoin fell 20% from its Saturday high of $62.5k, briefly hitting $50k while flushing out greedy traders on futures markets. Are there reasons to be worried? Perhaps. But, first, let's understand why that happened, so you can be able to spot future situations where the market is overleveraged.
As anticipated, as soon as $57k was breached around 3h20am UTC Sunday (following FUD regarding money laundering and Coinbase's public listing), it only took 15 minutes for BTC to spectacularly find support near $50k. Why was that? Because $57k was an obvious support level. This means there was an incentive to bet that many people had placed their stop losses or planned their liquidation levels at that point. So there was a lot of money to be made by pushing price lower and then buying back at a better price. This could easily be done as, in this case, stops and liquidations trigger automatic sell orders, which depress price. Now, the million-dollar question is what can happen next? Read along!
Chart art: this is how trends take a break.
Market musings: it's going to be a red week.
Bulls and bears are currently fighting for the unfettered continuation of this bull market and both have equally interesting arguments. The optimists remark dips always exist and that in January we had already retraced +30% without a problem. Additionally, many alts are still pumping, which means the BTC and ETH crash is compounded by traders selling these leading coins to buy new projects. All-in-all, this is just bearish drama and nothing fundamental really changed.
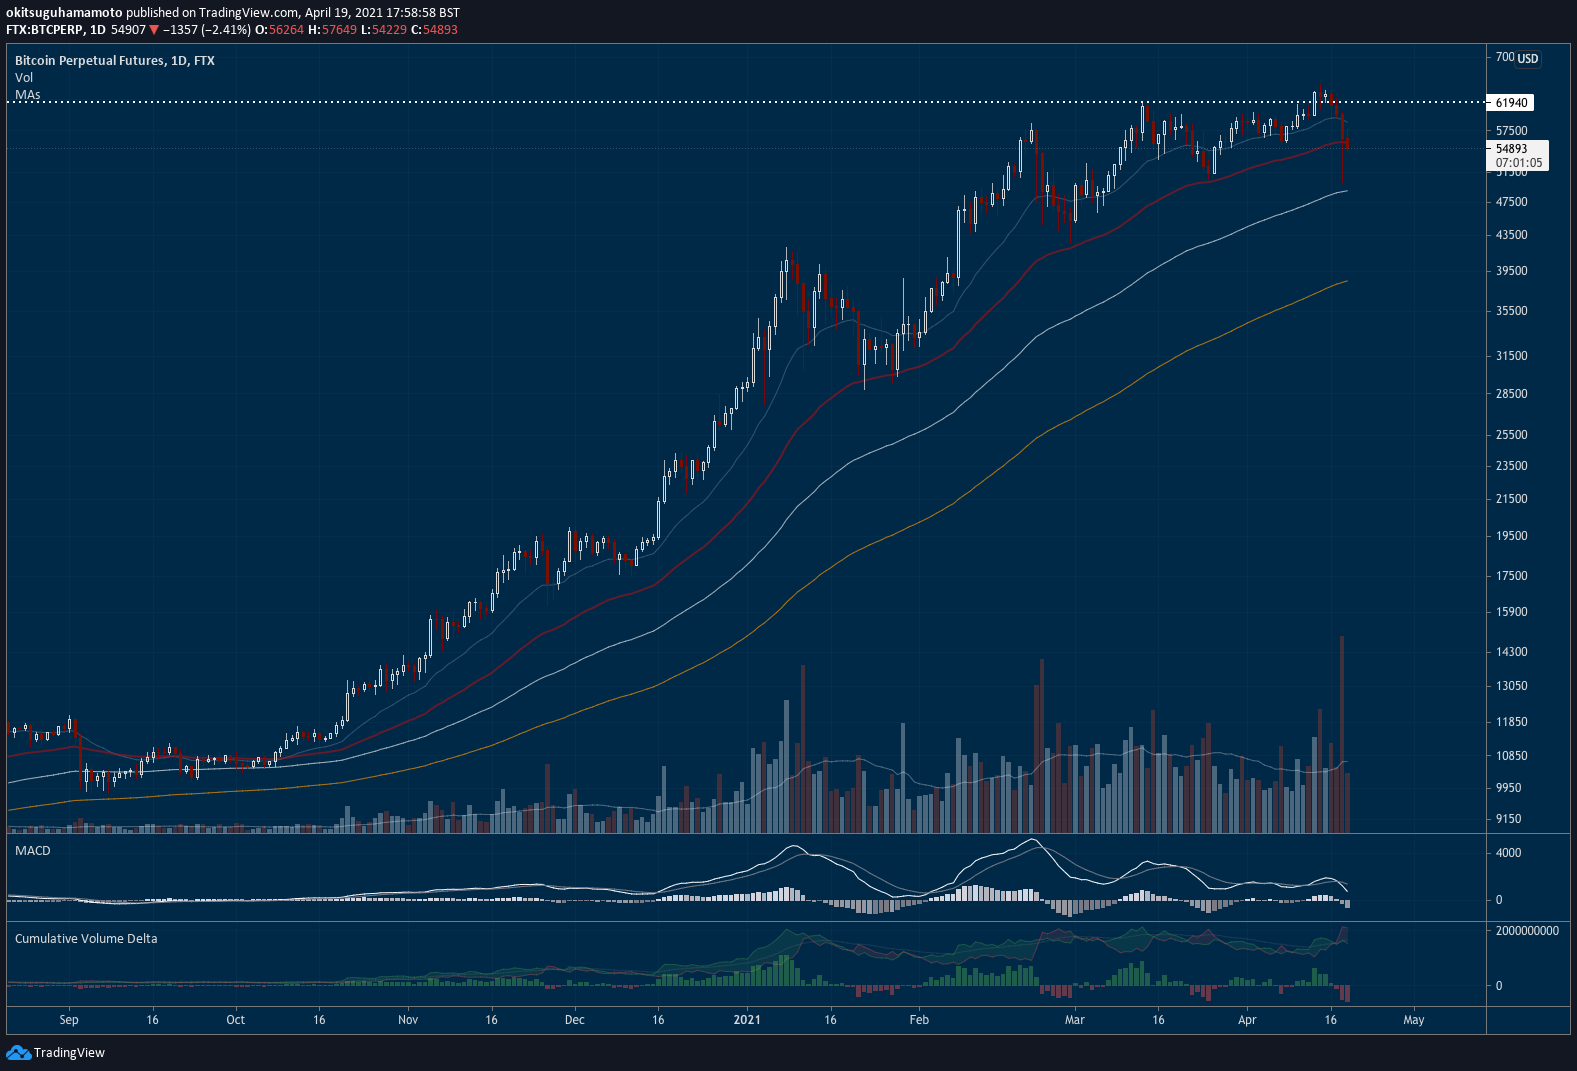
However, the pessimists note it's the first time since October that bitcoin fails to hold the 50-day moving average, marked in red in the chart above. So if bulls want a chance, today's close should be above $56.8k. Otherwise, traders will see this as a bearish sign and will likely flip short - eventually until we hit the 200-day MA (the yellow line above), which is currently sitting around $38.5k. This level would surely scare many traders, which means we could find our local bottom there.
Lastly, the realists remind us BTC has been pumping for six straight months. And that it seems we're going through a 2013-style run, which also had six months of continued growth and then experienced three red months - also over the summer. Does history repeat itself? Possibly. Do fears repeat themselves? Surely! So plan your trading and follow Coinbase's stock price to see if it falls short of the market's unrealistic expectations. This will give you an hit hints of where does BTC and the rest of the market go next! Just don't forget to zoom out and understand that even if we crash for a couple of months, this isn't the end of this bull market - yet!
Visual block: see how funding incentivises traders?
Three things: sub-title
- Curious in knowing more about the wider bull market? Scott Galloway shares his take on the current euphoria while also covering the latest NFT hype.
- Curious in knowing more about options trading and specific options strategies? Deribit Insights has you covered.
- Curious in knowing more about Sushiswap, the popular decentralised exchange and its token? Josh Olszewicz always covers your back.
Meme moment: trading art is an art.

Email eagerness: add us as a contact.

Get started: download the B21 Crypto app!


